- Today
- Total
| 일 | 월 | 화 | 수 | 목 | 금 | 토 |
|---|---|---|---|---|---|---|
| 1 | 2 | 3 | 4 | 5 | 6 | |
| 7 | 8 | 9 | 10 | 11 | 12 | 13 |
| 14 | 15 | 16 | 17 | 18 | 19 | 20 |
| 21 | 22 | 23 | 24 | 25 | 26 | 27 |
| 28 | 29 | 30 | 31 |
- 코인
- typescript
- 3주차
- javascript
- Coin
- Firebase
- 에러
- 주식차트
- 차트
- 주식
- graphql
- Flutter
- 리액트
- 코인차트
- chart
- typeorm
- 차트만들기
- API
- react
- error
- 항해99
- Redux
- nestjs
- nextjs
- 비전공자
- apollo
- 채팅
- 차트구현
- websocket
- rtk
Act99 기술블로그
[React] 주식사이트 만들기-5 실시간 코인 차트 만들기 [Redux, Crypto Compare] 차트 라이브러리x 본문
[React] 주식사이트 만들기-5 실시간 코인 차트 만들기 [Redux, Crypto Compare] 차트 라이브러리x
Act99 2021. 12. 7. 16:35사실상 이것을 만들기 위해 여태까지 달려왔다고 해도 무방하다.
최종 목표는 실시간 데이터를 불러오고 차트를 구현시키는 것이였다.
그리고 이번에 할 것은 실시간 코인차트 만들기이다.
먼저, 내가 사용할 CryptoAPI (코인 시세 API) 사이트는 CryptoCompare 사이트이다.
https://www.cryptocompare.com/
Cryptocurrency Prices, Portfolio, Forum, Rankings
Track cryptocurrency markets with live prices, charts, free portfolio, news and more.
www.cryptocompare.com
회원가입을 해준 후, 무료 API-Key 를 받는다.
다음 사용 목적을 적은 후 앱을 만들어주고 API Docs에 들어가면

이렇게 코인 데이터를 받을 수 있다.
이젠 RTK Query 를 이용해 API 데이터를 불러와 줄 것이다.
https://bugerstory.tistory.com/42
[React] 주식사이트 만들기-2 코인API 가져오기 (with Redux toolkit)
오늘은 코인 API 를 가져와 실시간 데이터를 가져오는 작업을 할 예정이다. 결론부터 얘기하면 Redux에 대해 더 공부할 필요성을 느꼈다. (Redux 사용하기 위한 빌드가 꽤 난해하다고 생각했기때문.
bugerstory.tistory.com
여기서 재밌는 사실은 CryptoCompare 에서 API 를 가져올 때, API Key를 필요로 하지 않고 url 로만 호출이 가능하다는 것이다. (보통은 api-key가 필요한데 말이다.)
이점을 이용해서 RTK-Query를 적용시켰다.
const cryptoCompareURL = "https://min-api.cryptocompare.com/data/v2";

export const cryptoCompareHistoryApi = createApi({
  reducerPath: "cryptoCompareHistoryApi",
  baseQuery: fetchBaseQuery({ baseUrl: cryptoCompareURL }),
  endpoints: (builder) => ({
    getCryptoCompareHistory: builder.query({
           query: ({ limit, coin }) => {
        return {
          url: `/histoday?fsym=${coin}&tsym=USD&limit=${limit}`,
        };
      },
    }),
  }),
});

export const { useGetCryptoCompareHistoryQuery } = cryptoCompareHistoryApi;
// 여기서 use${builderName}을 export 한다고 보면 된다.
다음 reducer에 추가시켜주고 coin차트로 불러와준다.
- coinchart.tsx
import React, { useState } from "react";
import {
  useGetCryptoCompareHistoryQuery,
  useGetCryptosHistoryQuery,
} from "../../services/cryptoApi";
import { dataToArray } from "../../functions/data-to-array";
import { Candle } from "../../components/chart/common/candle";

type Props = {
  width: number | undefined;
  height: number | undefined;
};

export const CoinChart: React.FC<Props> = ({ width, height }) => {
  // const { data, isLoading, error } = useGetCryptosHistoryQuery("1");
  const [name, setName] = useState("BTC");
  const [defaultLimit, setdefaultLimit] = useState(1000);
  const [dataLength, setDataLength] = useState(900);
  const dataDefaultMinusLength = 18;
  const { data, isLoading, error } = useGetCryptoCompareHistoryQuery({
    limit: defaultLimit,
    coin: name,
  });
  const dataArray: any[] | undefined = [];
  const readingData = async () => {
    return !isLoading ? dataArray.push(data.Data.Data) : null;
  };
  readingData();
  const coinDummyArray = dataArray[0];

  const coinArray: any[] = [];
  coinDummyArray
    ?.slice(dataLength, coinDummyArray.length)
    .forEach((item: any) => coinArray.push(Object.values(item)));
  console.log(coinArray);

  const dataWheelHandler = () => {
    window.onwheel = function (e) {
      e.deltaY > 0
        ? setDataLength(
            dataLength < dataDefaultMinusLength
              ? dataLength + 0
              : dataLength - 8
          )
        : setDataLength(
            dataLength > defaultLimit ? dataLength + 0 : dataLength + 8
          );
    };
  };
  // 추후 1000개 이상의 데이터를 필요로 할 경우 데이터 끌고오기 (아래)
  // setDataLength(
  //   dataLength >= defaultLimit ? defaultLimit + 500 : defaultLimit + 0
  // );
  // dataLength >
  console.log(coinArray);
  console.log(coinDummyArray);
  console.log(dataToArray(coinArray, 1));

  //** */ 데이터 배열 순서 : time, high, low, open, volumeFrom volumeTo, close
  return (
    <div onWheel={dataWheelHandler}>
      <Candle
        width={width}
        height={height}
        date={dataToArray(coinArray, 0)}
        open={dataToArray(coinArray, 3)}
        close={dataToArray(coinArray, 6)}
        high={dataToArray(coinArray, 1)}
        low={dataToArray(coinArray, 2)}
        name={name}
      />
    </div>
  );
};
여기서 코인 이름을 useState 시켜준 이유는 버튼을 누러서 코인을 선택할 수 있게 만들기 위해서이며,
defaultLimit 을 useState 시켜준 이유는 만약 사용자가 최대치로 축소시켰을 때 다시 데이터를 로딩시켜오기 위해서이며
dataLength 를 useState 시켜준 이유는 확대 축소 UI를 데이터 로딩으로 구현하기 위해서이다.
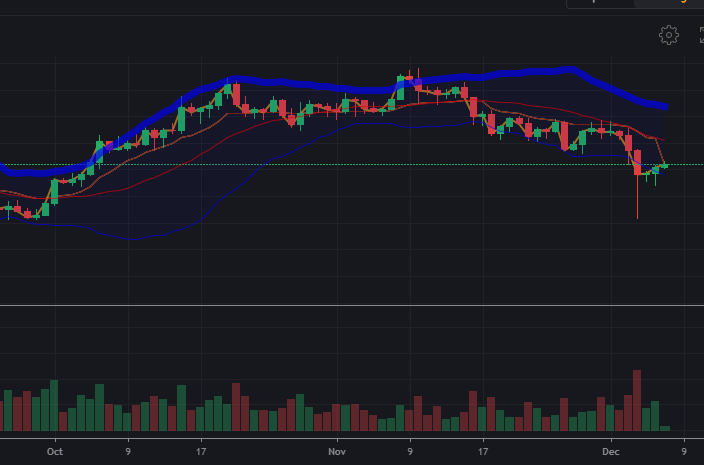
그 결과


세로폭이 커서 폭이 길게 나오는 것 빼곤 정확하게 데이터가 들어온다.
이젠 거래량과 이평선, 볼린저밴드 구현할 차례이며,
그 다음 (데이터 리로딩작업 & 여러 코인 선택 버튼) 을 구현할 것이다.
'개발팁저장소 > react' 카테고리의 다른 글
| 항해99 3주차 주특기 기본 - 날짜별 별점 누르기 + (캘린더 일기 만들기) (1) | 2022.01.22 |
|---|---|
| 항해99 3주차 주특기 기본 - 날짜별 별점 누르기 + (캘린더 일기 만들기) (0) | 2022.01.21 |
| [React] 주식사이트 만들기-4 코인API 로 차트 만들기 (라이브러리x) (0) | 2021.12.06 |
| [React] 주식사이트 만들기-3 코인API 로 표 만들기 (with React table) (0) | 2021.12.06 |
| [React] 주식사이트 만들기-2 코인API 가져오기 (with Redux toolkit) (0) | 2021.12.06 |


